Stats Analysis: A Statistics Engine That Never Leaves Your Browser
The trust problem with browser-based statistics tools
Run a t-test online and you have two bad options. Upload your CSV to a server and hope whoever runs it is trustworthy with your data — a real problem the moment the data is patient records, unreleased product measurements, or anything else you cannot casually ship to a third party. Or use a tool that reimplements the statistics in JavaScript, which means every p-value you read is only as trustworthy as someone’s from-scratch port of scipy, checked against nothing in particular.
Neither option is acceptable when the numbers feed a decision. What you actually want is the real thing — numpy, pandas, scipy, statsmodels, the libraries the field already trusts — running where your data already is, with no upload step to trust or distrust.
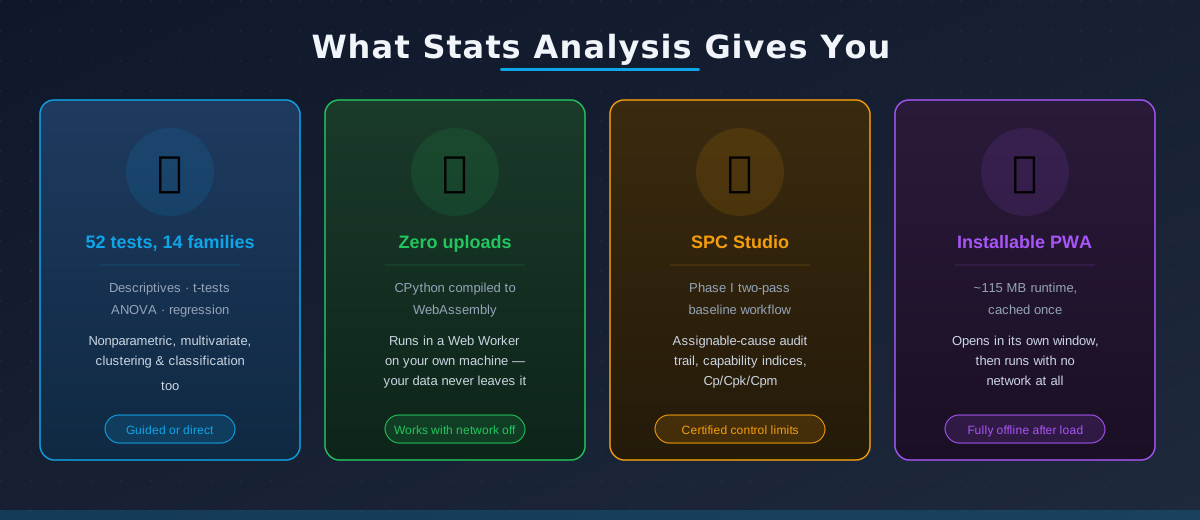
Stats Analysis is a Progressive Web App that does exactly that. Drop in a CSV or Excel file and it runs descriptives, normality tests, t-tests, ANOVA, correlation, regression, chi-square, multivariate methods and statistical process control — entirely inside your browser, on your own machine, with nothing sent anywhere.
What’s inside
Four workspaces cover a typical session: import on Data, look around on Explore, use Guided if you’re not sure which test fits your question, then run it on Analyze. A fifth, SPC, runs a dedicated Phase I control-chart workflow described below.
Underneath, the test catalogue spans 52 tests across 14 families — t-tests, ANOVA (one-way, Welch, two-way, repeated-measures, ANCOVA), nonparametric alternatives, correlation, regression, categorical tests, multivariate methods, clustering, classification, reliability, and SPC. Every run returns a plain-language summary, an APA-style line ready to paste into a write-up, the test statistic and p-value, effect sizes with confidence intervals, assumption checks, tables and a plot.
One wheel, two runtimes
This is the part of the architecture that makes the “trust me, it’s real scipy” claim actually checkable rather than asserted.
The statistics live in stats_core — a framework-free Python package with no dependency on Django, Flask, or anything web-specific. It’s built on numpy, pandas, scipy, statsmodels and scikit-learn, and it is packaged as a single wheel. That wheel is installed in two completely different places:
- On CPython, under pytest, in CI, as an ordinary Python test suite.
- Inside a Pyodide runtime — CPython compiled to WebAssembly — running in a Web Worker in your browser.
It’s the same wheel both times. The Web Worker’s boot sequence (frontend/src/compute/pyodide.worker.ts) loads Pyodide, loads numpy/pandas/scipy/statsmodels/scikit-learn as native Pyodide packages, then hands micropip the wheel with deps=False — that flag matters, because the scientific packages are already loaded as compiled WASM builds, and letting micropip resolve dependencies itself would mean installing a second, incompatible pure-Python copy of scipy on top. What ends up running when you click “Run” in the browser is not a reimplementation that happens to agree with the test suite most of the time — it is the literal artefact the test suite validated.
The runtime itself is vendored, not fetched from a CDN: pyodide.loadPackage is pointed at files served from the app’s own origin, and requesting a package that was never bundled fails the boot outright rather than silently falling back to a network fetch. That’s a deliberate constraint, not an oversight — the app has to keep working on a firewalled network or with a device already offline, and a CDN fallback would quietly break that promise the first time someone tested it that way.
All data crossing the Worker boundary goes as JSON strings rather than passed-by-reference PyProxy objects, which keeps the Python side ignorant of anything browser-specific and avoids leaking WASM memory handles into JavaScript’s garbage collector.
SPC Studio: making “we removed that outlier” defensible
Everything else in the app is cross-sectional — compare these groups, model this relationship. Statistical process control adds an axis none of that has: time order. A batch of process data usually contains genuine out-of-control periods, and the central risk in building a control chart baseline is letting those periods define what “normal” looks like.
The naive fix — keep removing flagged points and recomputing until nothing violates the rules — is a well-documented trap. Oakland calls the result “utopia limits”: each removal tightens the limits, which exposes fresh violations in what’s left, which triggers more removals, in a cascade that ends with limits describing nothing real. Stats Analysis caps this at exactly two passes.
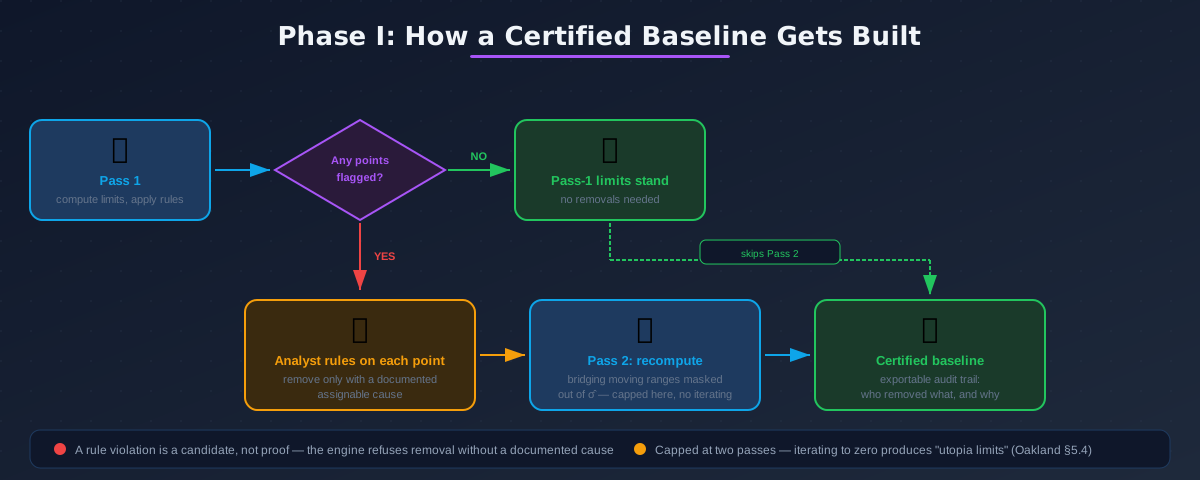
Pass 1 computes the I-MR control limits from the full dataset and applies the configured rule set — by default Oakland’s four (a point beyond 3σ; a 2-of-3 warning-zone signal; a run of 8; a trend of 6), with Western Electric’s and Nelson’s published rule sets available as named alternatives. Every flagged point goes to the analyst.
The analyst can only remove a point by supplying a documented assignable cause — “Chiller unit tripped at 02:30, maintenance log WO-2024-1142”, not “looked wrong”. This is checked twice: the Studio UI won’t let you certify a baseline while any removal lacks a cause, and independently, the underlying finalise() function raises AssignableCauseRequired if you try to bypass that with removals that have none — regardless of what the UI does or fails to do. The UI check is a courtesy; the engine check is the actual guarantee, since the same stats_core package is what a script or a test would call directly.
If nothing gets removed, Pass 1’s limits are the baseline and the workflow stops there. If points come out, Pass 2 recomputes the limits on what remains — with one detail that’s easy to get wrong: removing a point from the middle of a series leaves the moving range calculated across the gap spanning two observations that were never actually adjacent. Including that bridging range in corrupts , which every control limit is built from. The engine masks those bridging ranges out (bridging_mr_mask) rather than silently including them — and, notably, this does not reliably make the limits tighter: if the bridging range happened to be the smallest one present, excluding it actually raises . The direction depends on the data, and both directions are covered by test.
Whatever Pass 2 still flags gets reported, not acted on — no third pass, no further pruning. Above a 20% removal rate the Studio flags the baseline period itself as suspect, on the theory that the right response by then is reselecting the period, not pruning harder.
Everything the analyst decided — which points, which cause, which pass — lands in an exportable audit log, keyed to the actual observation label rather than a row index (an index would silently collapse two batches sharing the same date, exactly what an audit trail must never blur).
Capability, honestly reported
Once a baseline is certified, the Studio also reports process capability — , against short-term , , against the overall sample spread. A gap between and means the process is off-centre, not too variable; a gap between and means there’s drift between subgroups a healthy alone won’t reveal. Because ‘s sampling variability is larger than its usual three decimals suggest, the Studio also reports Bissell’s approximate 95% interval — at , a reported of 1.33 is compatible with anything from roughly 1.0 to 1.7. And because Cp/Cpk’s sigma-to-probability conversion is only valid under normality, the app surfaces two non-normal alternatives — ISO 22514-2’s percentile method and a Box-Cox transform — the moment the normality pre-check fails, rather than quietly reporting an optimistic number on skewed data.
The SPC engine itself was folded in and hardened from an earlier standalone project, SPC-analysis; at default settings the two agree exactly, verified across 300 randomised series covering every control line, all four rules, and the moving-range rules.
Installing it: PWA rules that actually bite
Because the entire engine runs client-side, installing the app is not a marketing checkbox — it changes what the app can do offline. Once the ~115 MB of Pyodide and its scientific packages have downloaded once and been cached by the service worker, a network-off reload still works.
Two platform quirks are worth knowing before deploying your own instance behind a tunnel:
- Safari on macOS is a dead end for offline use. Add to Dock produces a standalone window, but it doesn’t retain the Pyodide cache, so the installed app can’t start without a network — which defeats the point. The in-app banner tells Safari/macOS users to switch to Chrome or Edge rather than walking them through an install that would just break.
- iOS makes installing mandatory, not optional. WebKit evicts cached data after about a week of disuse, and home-screen web apps are exempt from that eviction. Skip installing on an iPhone and the runtime gets silently thrown away and re-downloaded.
Behind a Cloudflare Tunnel specifically, two zone settings will make the app look simply broken if left on: Rocket Loader rewrites <script> tags and takes down the Pyodide worker, and a “Cache Everything” rule on /sw.js or /index.html pins visitors to a stale service worker.
Under the hood
| Layer | Technology | Notes |
|---|---|---|
| Compute | Pyodide (CPython → WASM) in a Web Worker | runs numpy, pandas, scipy, statsmodels |
| Statistics | stats_core | framework-free Python package; identical code under pytest and in-browser |
| UI | React + TypeScript + Vite | |
| Offline / install | vite-plugin-pwa (Workbox) | app shell precached; Pyodide runtime cached on first use |
| Persistence | IndexedDB via Dexie | datasets and saved analyses stay on-device |
| Charts | Vega-Lite | |
| CI | GitHub Actions | pytest + frontend typecheck on every PR; Docker build verified for amd64 and arm64 |
| Deploy | GitHub Actions → GHCR | multi-arch image, tagged latest + sha-<short>, smoke-tested with docker run --network none before the run is called green |
| Container | Docker (multi-stage) → nginx | docker compose up web, no backend service required |
That final CI step is worth dwelling on for a second: the published image is actually started with networking disabled and confirmed to still serve the PWA correctly, so “works with no network” isn’t a claim in the README — it’s a gate the build has to pass.
Try it
The live app is at stats-analysis.box2overtake.com — drop in a CSV and it starts downloading its runtime immediately. The source, including the full stats_core package and its test suite, is public at github.com/jlleongarcia/stats-analysis.
Your data doesn’t need to trust a server it’s never met. It just needs a browser.
Last modified: 14 Sep 2026